Comparison: Force Profile from Weights vs Resistance Bands
The most common way to train for strength is to use weights, and whether you use free weights or selectorized weight stack machines the experience felt by the body is similar. Moving a fixed mass against the force of gravity is a familiar routine to our muscles. After all, this phenomenon happens every time we take a step, lift our coffee mug off the desk, or scoop up that laptop bag on our way into work. It therefore makes sense to exercise our body in this fashion because it is a good representation of the tasks we expect to encounter in day-to-day life.
Resistance cables – stretchy rubber tubes or strips – are a slightly different beast. These devices weigh very little, but it isn’t their mass that is used as the source of resistance. Rather, they are stretched and as they are elongated there is a reactive force that strives to pull it back to its original length. The force is proportional to how far the bands are stretched, meaning that the farther they are stretched the greater the reactive force. In other words, they behave like a spring.
To highlight the subtle differences in these force profiles we performed and recorded two sample sets here at the ShapeLog Lab:
- Five bicep curl reps on our multi-gym using a resistance cable (labeled “30 lbs”) attached to the weight-selector tube of our multi-gym to provide resistance instead of the weight stack. The label of 30 lbs is an approximate “feels like” value used by the manufacturer to help exercisers choose the right resistance band. The actual force depends on how far the tube is stretched. When relaxed the force is 0 lbs but when folded and half and pulled sufficiently we also observed force values in excess of 100 lbs.
- Five bicep curl reps at 50 lbs, using our multi-gym in its intended fashion. This weight setting was selected because it felt similar to the resistance provided from the resistance cable in Set #1.
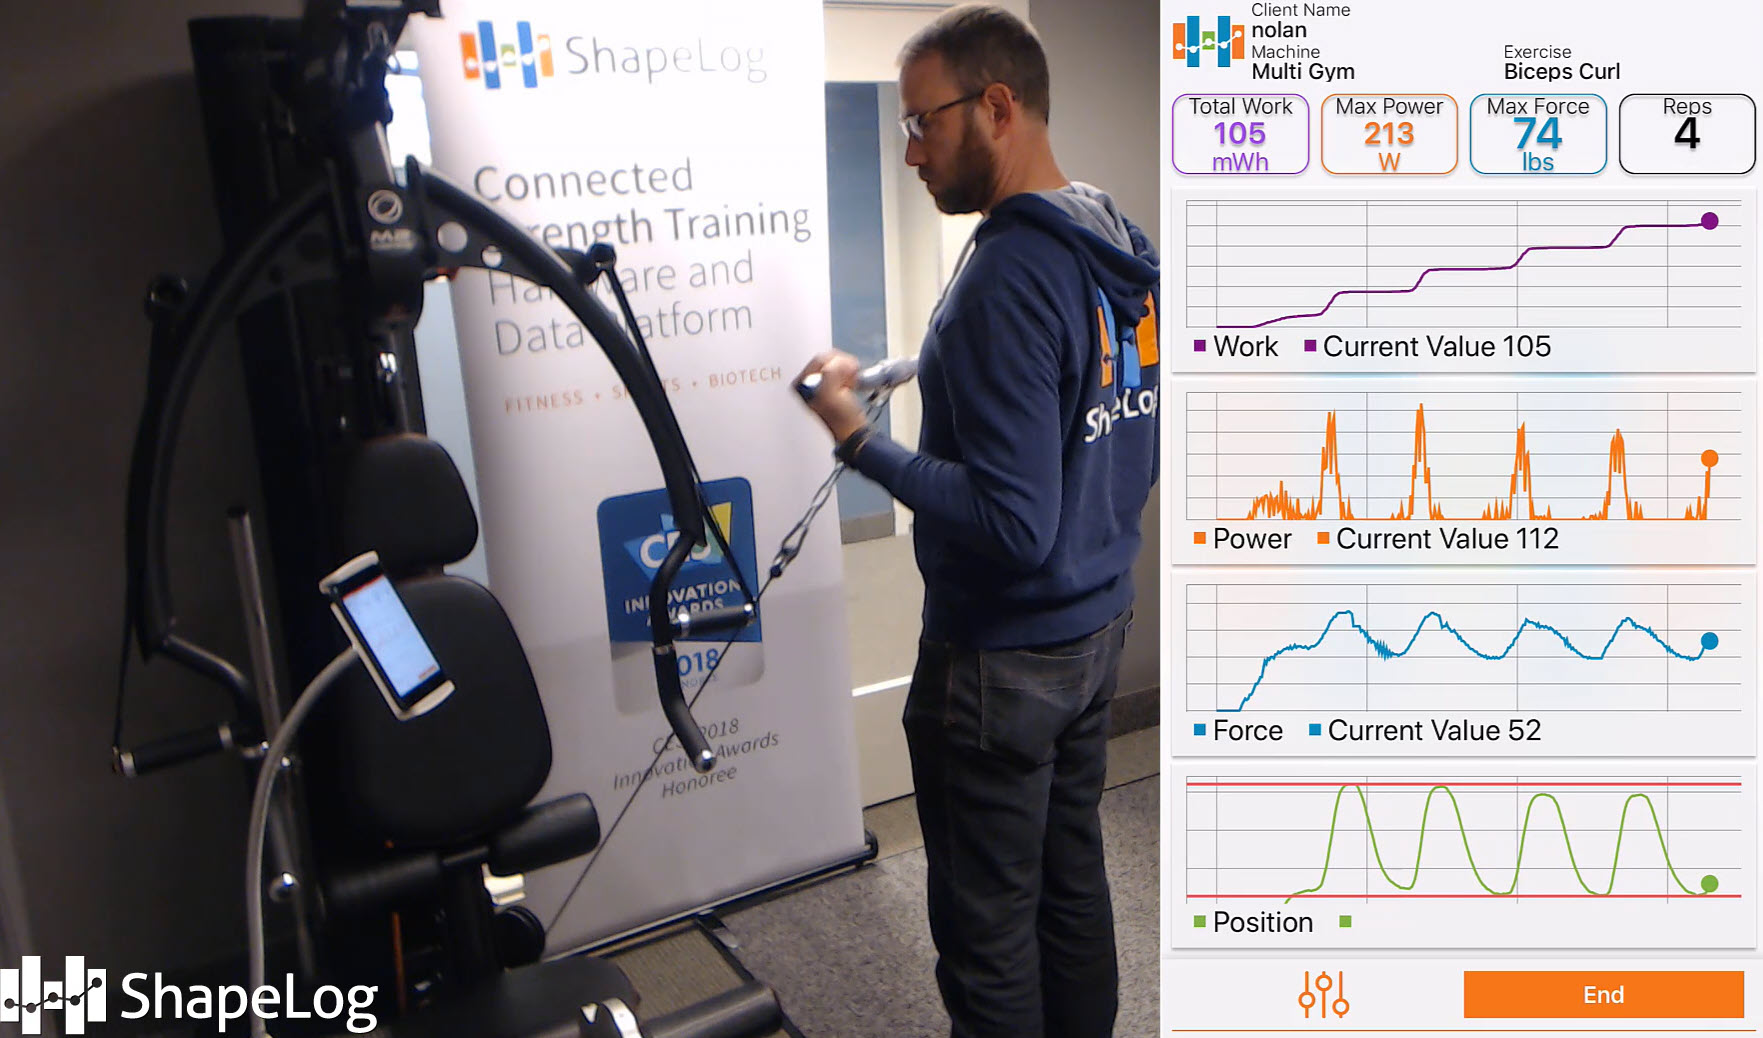
A video of these two sets is provided below. Look closely at the blue “Force” line to see the different behaviors between these two sets. In the case of Set #1 (resistance band) the force is tightly coupled to the position data (the bottom, green line). This is to be expected because the amount of force is defined by how far the resistance band is stretched. In the case of Set #2 the force is ~ 50 lbs when the weight stack is still but fluctuates above and below that value when the weights are accelerated or decelerated, respectively. In a single upstroke, for example, the weights are accelerated to begin the upward motion resulting in force values above 50 lbs, but then as the velocity slows there is a deceleration (or negative acceleration) that results in force values below 50 lbs. Similar behavior (but in opposite order) happens each time the weight stack is lowered.
For easier side-by side viewing the results that were captured and displayed in that video (using our demo app) are also shown below as still images. The results are surprisingly similar given that the resistance cable and weight setting were both somewhat arbitrarily chosen. When performing Set #1 I chose to stand at a distance from the machine that yielded a comfortable resistance but had I stepped farther away the resistance cable would have yielded more resistive force and therefore greater work and max force results.
The position data (shown in green) is nearly identical. This close correlation is to be expected because I stood in the same position and performed the same motion in both sets. My arm length is of course and fixed and range of motion was consistent so the resulting position profile of the sensor was also consistent.
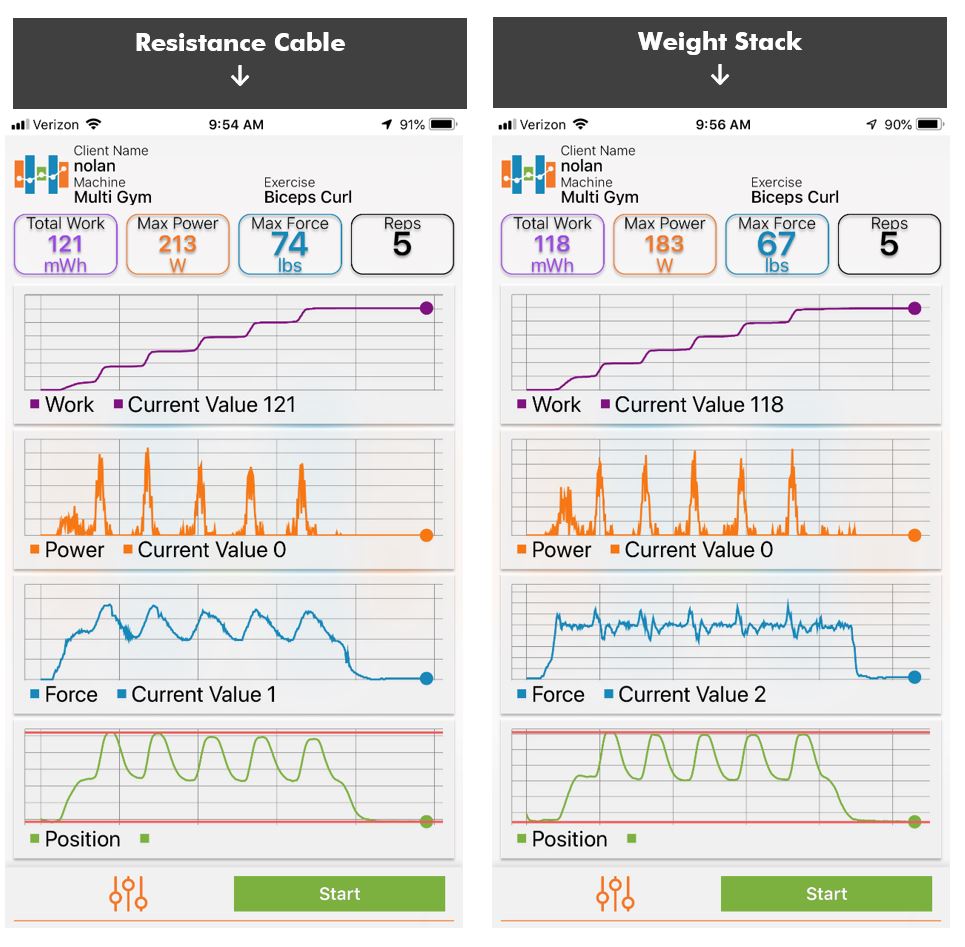
Results from the ShapeLog app showing a comparison between the Resistance Cable and Weight Stack. Note the difference in shape between the blue “Force” line for these two sources of resistance.
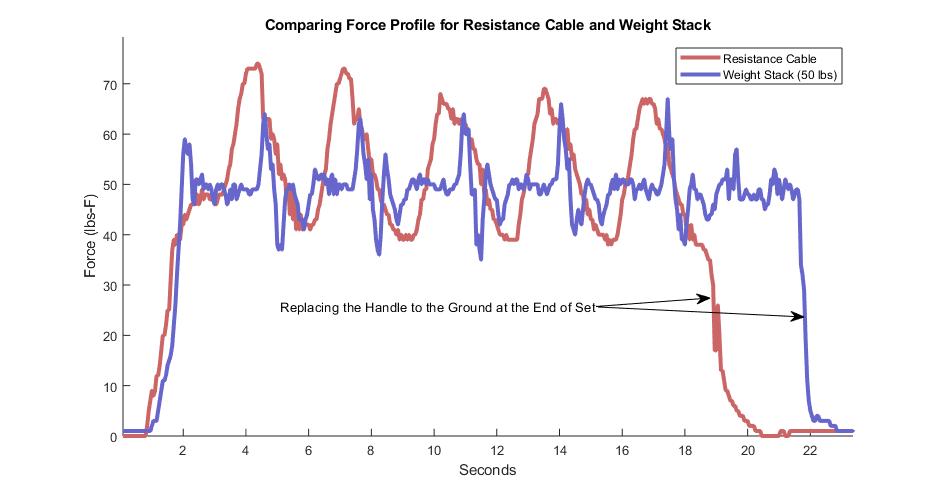
Because three of the four data streams are so similar, let’s isolate the force data for the two sets and overlay them in a plot (below). The unique shape of the two force profiles is easy to observe, with the resistance cable showing the characteristic broad, saw-tooth like force variability while the weight stack force profile quickly equilibrates around the weight setting when the weights are lifted but responds instantly to every subtle acceleration and deceleration.
Another distinction between these two force profiles is the behavior at the end of the set, as indicated in the plot. Note that when the weights are lowered after the final rep the force remains constant at approximately 50 lbs-F until they are finally laid to rest. At that point the tension is removed from the cable and the force value immediately drops to zero. In the case of the resistance band, conversely, there is a more gradual slope all the way up until all tension is removed. For some exercise settings (such as rehabilitation or physical therapy) optimizing the ergonomic experience of the completion of an exercise could be critical. For example a patient might be able to curl 20 lbs without any strain but bending over to replace those weights on the ground at the completion of a set could pose a risk.